Memory Management in Go: The Trip to Assembly and Escape Analysis
Stack, Heap, Escape Analysis

Two functions that look almost identical can produce very different memory behavior in Go. The difference is often not in what you wrote, but in what the compiler can prove.
When engineers say that a value “went to the heap”, they often describe the symptom, not the mechanism.
The mechanism is escape analysis.
Go’s compiler is constantly asking a precise question: can this value stay inside the lifetime of the current stack frame, or must it outlive the function that created it? If it cannot prove stack safety, it promotes the value to the heap.
This article is a guided lab. We will:
- build a solid mental model for stack vs heap in Go,
- inspect real compiler decisions with
-gcflags="-m", - read just enough assembly to connect cause and effect,
- measure the impact with benchmarks,
- and end with practical rules for production code.
Series note: this is Part 1 of a three-part deep dive into Go internals. Part 2 covers the GMP scheduler and Part 3 covers interface dispatch, method tables, and de-virtualization.
Stack vs Heap in Go: The Model That Actually Matters
Every goroutine has its own stack. That stack holds parameters, local variables, temporary values, and metadata associated with the current call chain.
The key detail is not that stack is “fast” and heap is “slow”. That framing is too shallow.
The detail that matters is lifetime.
- A value can stay on the stack if its lifetime is provably bounded by the current function frame.
- A value must move to the heap if it can outlive that frame, or if the compiler cannot prove that it will not.
Why do we care when a value moves to the heap?
Because heap allocation can imply:
- more pressure on the garbage collector,
- worse memory locality,
- more pointer chasing,
- and often higher
allocs/opin hot code paths.
But there is a trap here: heap allocation is not automatically a bug. If you treat every escape as failure, you will start rewriting clear code into brittle code with no measurable gain.
The correct question is not “how do I avoid all escapes?” The correct question is: which escapes are material in this workload?
What Escape Analysis Is Really Doing
Escape analysis is a static, conservative analysis performed by the compiler.
Conservative means the compiler does not need to prove that a value will escape. It only needs to fail to prove that the value is stack-safe.
That single fact explains many surprising outcomes.
You can use this rule of thumb:
- If the compiler can fully reason about the value’s lifetime, it may keep it on the stack.
- If the value is returned by reference, captured, shared, boxed, or passed into a context with uncertain lifetime, it is a candidate for heap allocation.
- If the compiler lacks enough evidence, it chooses correctness over optimism.
This is why escape analysis is deeply related to inlining, interface conversions, closures, and goroutine boundaries. Those language features expand or obscure the compiler’s visibility into lifetime.
Lifetime Pipeline Mental Map
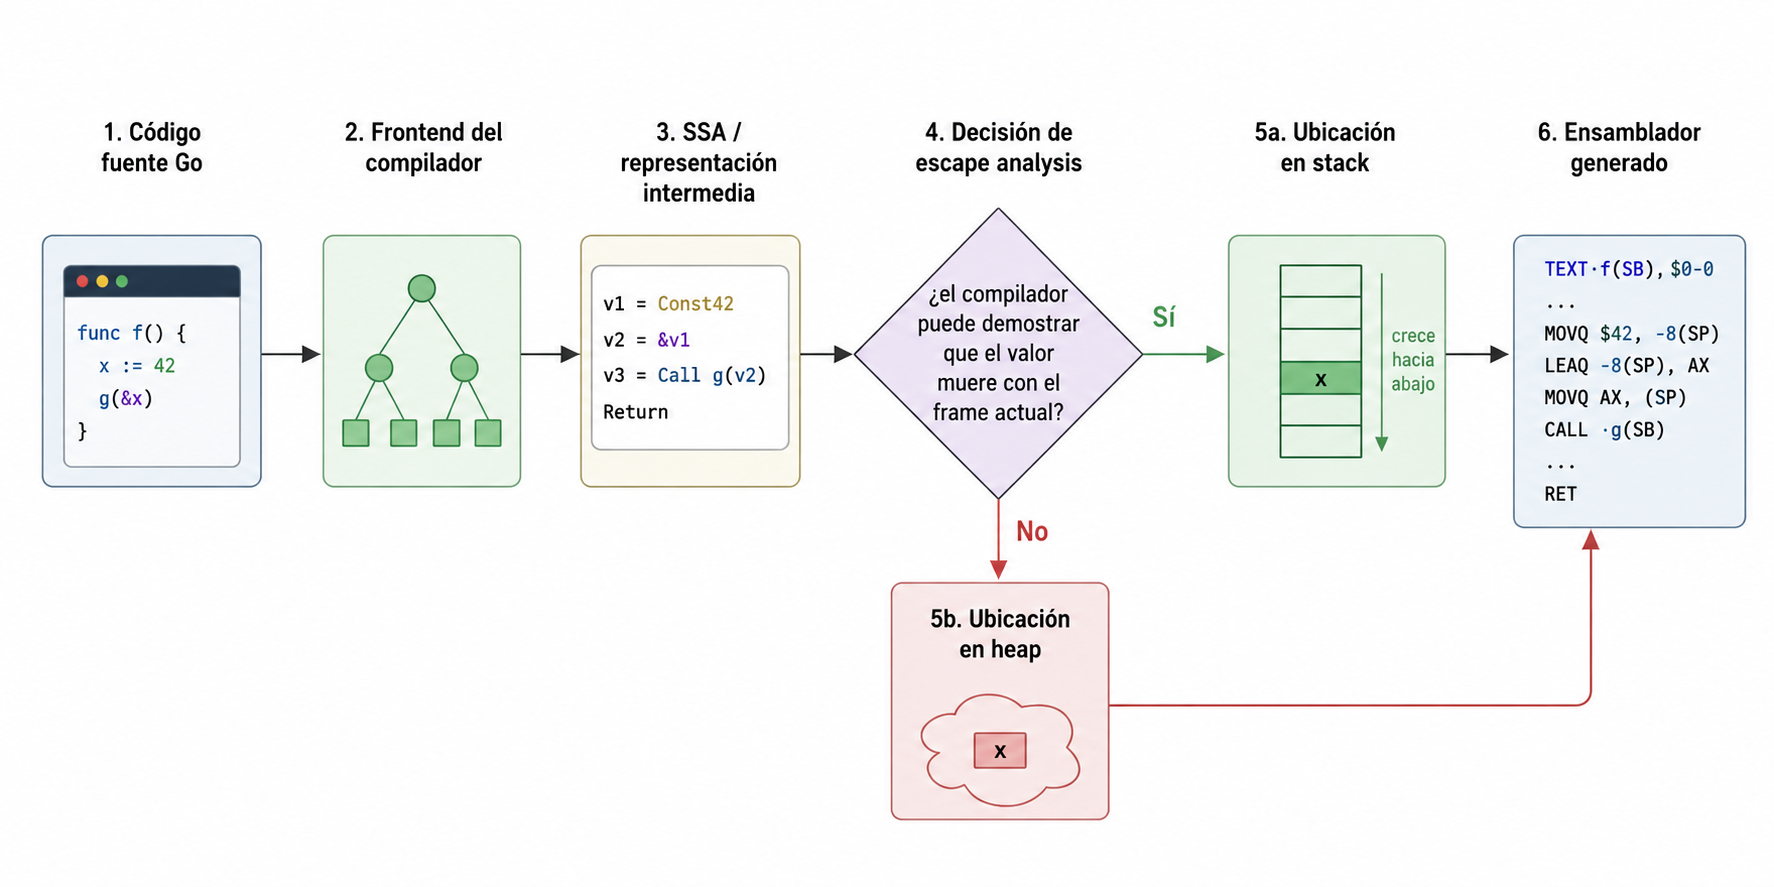
Figure: conceptual pipeline for escape analysis. If the compiler can prove that the value dies within the current frame, it stays on stack; if it cannot prove that, the value is promoted to heap.
First Experiment: Return by Value vs Return by Pointer
Let’s start with the smallest useful program.
package main

type user struct {
	id   int
	name string
}

func buildUserValue(id int, name string) user {
	u := user{id: id, name: name}
	return u
}

func buildUserPointer(id int, name string) *user {
	u := user{id: id, name: name}
	return &u
}

func main() {
	_ = buildUserValue(1, "gopher")
	_ = buildUserPointer(2, "runtime")
}
Compile it with:
go build -gcflags="-m" main.go
Then increase verbosity:
go build -gcflags="-m -m" main.go
What you should expect conceptually:
- the value returned by
buildUserValuecan remain stack-friendly, - the local
uinsidebuildUserPointermust outlive the frame because its address is returned, - so the compiler will report that
uis moved to the heap.
This is the first important lesson: in Go, returning *T is not just an API design choice. It is often a lifetime statement.
Reading -gcflags="-m" Without Lying to Yourself
The escape report is useful, but people routinely overread it.
Messages you will often see include:
moved to heap: xx escapes to heapdoes not escapecan inline ...
The last one matters because escape analysis and inlining interact. If a function is inlined, the compiler sees more context, and that can change the result of the analysis.
This is why a serious workflow compares both versions:
go build -gcflags="-m" main.go
go build -gcflags="-m -l" main.go
The -l flag disables inlining. If the diagnostics change, that is not noise. That is the compiler telling you that context changed the proof.
Closures: Lifetime That Survives the Function
Now let’s look at a classic capture.
package main

func counter() func() int {
	n := 0
	return func() int {
		n++
		return n
	}
}

func main() {
	next := counter()
	_, _ = next(), next()
}
Compile again with:
go build -gcflags="-m -m" main.go
Why does n usually escape here?
Because the returned closure keeps using it after counter has already returned. The variable no longer belongs only to the lexical block where it was declared. It belongs to a longer-lived environment that the runtime must preserve.
Whenever you return a closure, the right question is not “did I create a function value?” The right question is: what state did that function capture, and how long must that state now live?
Interface Conversions and Hidden Allocation Pressure
Interface values are another common source of confusion.
Consider:
package main

import "fmt"

type point struct {
	x int
	y int
}

func printAny(v any) {
	fmt.Println(v)
}

func main() {
	p := point{x: 10, y: 20}
	printAny(p)
}
Now inspect it:
go build -gcflags="-m -m" main.go
The important nuance is that not every interface conversion means a heap allocation, but interface conversion is a place where the compiler may need to box a value or preserve it differently than a plain static call would.
This is one reason why fmt.Println can distort microbenchmarks. It is not just printing. It is also forcing values through ...any and interface conversion machinery.
If you are benchmarking a tiny allocation-sensitive function, printing inside the benchmark can dominate the signal you think you are measuring.
Crossing Goroutine Boundaries
A pointer handed to another goroutine is another strong lifetime signal.
package main

func worker(data *int) {
	_ = *data
}

func main() {
	n := 42
	go worker(&n)
}
From the compiler’s perspective, once &n is sent into a goroutine, the value is no longer obviously confined to the current stack frame. It may be read after the current execution point advances, possibly after the current frame would otherwise be gone.
This does not mean every concurrency-related escape is avoidable. It means that concurrency changes ownership and lifetime, and the compiler responds accordingly.
The Assembly View: Looking for runtime.newobject
Compiler diagnostics are good. Assembly is better when you want to see where those diagnostics materialize.
Generate assembly with either of these commands:
go build -gcflags="-S" main.go
or:
go tool compile -S main.go
You do not need to become an assembly expert to extract useful information. Start by looking for a few patterns:
- the size of the stack frame,
- whether addresses are being taken,
- whether the function calls helpers in the runtime,
- and especially whether you see
CALL runtime.newobject(SB).
When a local value moves to the heap, runtime.newobject is one of the most common concrete signals you will encounter.
For the buildUserPointer example, the structure of the generated code will typically look much closer to “allocate object, initialize fields, return pointer” than to “reserve stack slot, return value copy”.
That is the bridge between the high-level report and the machine-level consequence.
Inlining Changes the Proof
Escape analysis is not a standalone pass floating in isolation. It benefits from simplification and context.
Consider this small helper:
package main

type pair struct {
	a int
	b int
}

func makePair(a, b int) pair {
	return pair{a: a, b: b}
}

func sum() int {
	p := makePair(10, 20)
	return p.a + p.b
}

func main() {
	_ = sum()
}
Try both:
go build -gcflags="-m" main.go
go build -gcflags="-m -l" main.go
When the helper is inlined, the compiler can reason directly about the construction and use of pair inside sum. Without inlining, the proof may be more conservative.
This does not always flip a stack-vs-heap decision, but when it does, it teaches an important lesson: lifetime analysis is easier when abstraction boundaries disappear.
That is one reason why tiny helper functions in hot paths can benchmark differently depending on whether they inline.
Measure, Do Not Guess
The final step is to turn theory into numbers.
Create a benchmark file like this:
package main

import "testing"

func BenchmarkBuildUserValue(b *testing.B) {
	for i := 0; i < b.N; i++ {
		_ = buildUserValue(i, "gopher")
	}
}

func BenchmarkBuildUserPointer(b *testing.B) {
	for i := 0; i < b.N; i++ {
		_ = buildUserPointer(i, "gopher")
	}
}
Run:
go test -bench=. -benchmem
What matters here is not the exact nanosecond count on your machine. What matters is the shape of the result:
ns/opB/opallocs/op
If the pointer-returning version allocates more and does so in a hot loop, now you have actionable evidence.
If the difference is irrelevant in your workload, the right optimization may be to keep the clearer API.
Practical Heuristics for Production Code
When you see a suspicious allocation profile in Go, follow this order:
- profile or benchmark first,
- identify the hot path,
- inspect with
-gcflags="-m -m", - compare with and without inlining using
-l, - inspect assembly only for the smallest critical slices,
- change code only if the measured cost justifies the loss in abstraction or readability.
Three common mistakes are worth calling out explicitly:
- Treating every heap allocation as a bug.
- Ignoring interface conversions and closures in benchmarks.
- Reading compiler output without considering inlining.
Illustration Brief for the Designer
1. Variable Lifetime Pipeline
Draw a left-to-right flow diagram with these stages:
- Go source code
- compiler frontend
- SSA / intermediate representation
- escape analysis decision
- stack or heap placement
- generated assembly
The center node should be a diamond asking: “Can the compiler prove the value dies with the current frame?”
If yes, route to stack. If no, route to heap.
2. Stack Frame vs Heap Object
Show a goroutine stack with three stacked frames. Highlight the current frame and a local variable inside it. Then draw a pointer escaping out to a heap object on the right. Label the stack as frame-scoped lifetime and the heap object as extended lifetime.
3. Return by Value vs Return by Pointer
Create a two-column comparison:
- left side: local struct returned by value, no heap promotion,
- right side: local struct whose address is returned, promoted to heap.
Under each side, add a small pseudo-assembly strip. The right side should visibly include runtime.newobject.
4. Common Escape Triggers Map
Create a radial map with five nodes:
- returned pointer,
- closure capture,
- interface boxing,
- goroutine handoff,
- uncertain callee lifetime.
Each node should have a one-line note describing why it extends or obscures lifetime.
5. Inlining Changes the Analysis
Show the same helper function analyzed in two tracks:
- without inlining: reduced context, more conservative proof,
- with inlining: full call-site context, stronger proof.
Make the visual emphasis about compiler visibility, not about speed.
Closing
Escape analysis is not a bag of tricks for pleasing the compiler. It is a model for reasoning about value lifetime.
Once you understand that model, heap allocation stops feeling magical. You can inspect it, explain it, and decide whether it matters.
In Part 2, we will switch questions. We will stop asking where values live and start asking who gets to run work in Go at all: the runtime scheduler.— title: “Go Memory Management: Stack vs Heap, Escape Analysis, and the Assembly Behind It” subtitle: “Stack, Heap, and Escape Analysis” date: 2026-06-13 author: “@SilentGopher” description: “A practical tour of Go memory management through stack vs heap, escape analysis, compiler flags, and assembly inspection.” tags: [“Go”, “Go Runtime”, “Compiler”, “Performance”, “Escape Analysis”, “Assembly”] draft: false
In Go, memory placement is not something you manually declare. It is something the compiler proves.
Two functions can look almost identical and still produce very different allocation behavior. One returns quietly with zero heap pressure; the other adds allocations, increases GC work, and introduces another layer of indirection. The difference is usually not in the surface syntax. It is in what the compiler can prove about the lifetime of your values.
This article is the first part of a three-part series on Go internals:
The goal here is practical: by the end, you should be able to look at a small Go function, form a hypothesis about whether a value stays on the stack or escapes to the heap, and then verify that hypothesis with compiler output and assembly.
Stack vs Heap in Go
Before talking about escape analysis, we need a precise mental model.
Each goroutine in Go has its own stack. That stack holds function parameters, local variables, temporary values, and bookkeeping needed by the current call chain. Unlike the traditional fixed-size stacks people often associate with C, goroutine stacks can grow and shrink over time. But the central property still holds: stack data is tied to the lifetime of a specific execution frame.
The heap is where values live when their lifetime cannot be safely constrained to the current frame. If a value must outlive the function that created it, or if the compiler cannot prove otherwise, it is promoted to the heap.
That does not make the heap “bad” and the stack “good.” It means there are tradeoffs:
- Heap allocations create more work for the garbage collector.
- Heap objects often reduce locality compared to tight stack-resident data.
- Returning or sharing pointers can introduce extra indirection.
- In hot paths, even a small allocation can become visible at scale.
The important question is not “how do I force everything onto the stack?” The right question is “why did this value escape, and does that matter here?”
What Escape Analysis Actually Does
Escape analysis is a static, conservative analysis run by the compiler. It tracks whether a value can remain safely inside the current stack frame or whether it needs a longer lifetime.
The word conservative matters. The compiler does not need to prove that a value will escape. It only needs to fail to prove that it will not.
That leads to the core rule:
If the compiler cannot prove that a value dies with the current frame, it moves that value to the heap.
This is why escape analysis should not be treated like folklore or superstition. The compiler is enforcing semantic correctness first, and optimization second.
Experiment 1: Returning a Value vs Returning a Pointer
Start with the smallest possible example:
package main

type user struct {
	id   int
	name string
}

func buildUserValue(id int, name string) user {
	u := user{id: id, name: name}
	return u
}

func buildUserPointer(id int, name string) *user {
	u := user{id: id, name: name}
	return &u
}

func main() {
	_ = buildUserValue(1, "gopher")
	_ = buildUserPointer(2, "runtime")
}
Compile it with escape diagnostics enabled:
go build -gcflags="-m" main.go
For a more verbose explanation from the compiler, use:
go build -gcflags="-m -m" main.go
What you are looking for is not the exact wording of a specific Go release, but the decision itself. In the buildUserPointer case, the local u needs to survive the return because its address escapes the function. The compiler therefore promotes it to the heap.
In buildUserValue, the returned data can be copied as part of the normal return path. No longer lifetime is required.
How to Read the Compiler Output
When you inspect -gcflags="-m", you will typically see messages like these:
moved to heap: uu escapes to heap... does not escapecan inline ...
Two practical warnings matter here.
First, do not read a single line in isolation. Inlining can completely change the context in which a value is analyzed. Second, “escapes to heap” is not itself a performance verdict. It is a lifetime decision. Whether it matters depends on frequency, object size, and where that code sits in your system.
This is why escape analysis is most useful when combined with benchmarks and, in performance-sensitive paths, a quick look at the generated assembly.
Common Patterns That Make Values Escape
There are several patterns that show up repeatedly in real Go code.
Returning pointers to locals
func buildUserPointer(id int, name string) *user {
	u := user{id: id, name: name}
	return &u
}
This is the canonical case. The address of u survives the frame.
Capturing variables in closures
package main

func counter() func() int {
	n := 0
	return func() int {
		n++
		return n
	}
}

func main() {
	next := counter()
	_, _ = next(), next()
}
The returned closure keeps n alive after counter returns, so the variable cannot remain tied only to that frame.
Passing through interfaces
package main

import "fmt"

type point struct {
	x int
	y int
}

func printAny(v any) {
	fmt.Println(v)
}

func main() {
	p := point{x: 10, y: 20}
	printAny(p)
}
Not every interface conversion produces a meaningful heap cost, but interface boxing is a common source of allocation surprises, especially when values cross API boundaries.
Sharing references with goroutines
package main

func worker(data *int) {
	_ = *data
}

func main() {
	n := 42
	go worker(&n)
}
Now the lifetime of n is no longer limited to the current synchronous path through main.
From Escape Analysis to Assembly
Compiler diagnostics are useful, but assembly makes the result tangible.
You can inspect the generated assembly with either of these commands:
go build -gcflags="-S" main.go
or:
go tool compile -S main.go
At first, do not try to read every instruction. Focus on a few structural signals:
- the frame size for the function,
- whether a local value stays in registers or stack slots,
- whether an address is taken,
- whether the function calls allocation helpers such as
runtime.newobject.
For the pointer-returning version, you will typically find a runtime allocation path. Conceptually, the compiler has to materialize an object whose lifetime extends beyond the frame. That is exactly what heap allocation gives it.
Experiment 2: Inlining Changes the Outcome
Inlining often changes escape decisions because it gives the compiler more context.
Use this example:
package main

type payload struct {
	a int
	b int
}

func makePayload() payload {
	return payload{a: 10, b: 20}
}

func sum() int {
	p := makePayload()
	return p.a + p.b
}

func main() {
	_ = sum()
}
Now compare the compiler output with and without inlining:
go build -gcflags="-m" main.go
go build -gcflags="-m -l" main.go
The -l flag disables inlining. In many cases, disabling it removes optimization context and makes the compiler more conservative. That does not mean inlining exists only to avoid escapes, but it often changes the shape of the proof.
This is one of the most common reasons engineers misread escape analysis output. They look at a helper function in isolation and forget that the real compiled program may inline it away.
Benchmarks: Does the Escape Matter?
Compiler theory becomes engineering only when you measure it.
Create a file named main_test.go next to the previous sample:
package main

import "testing"

func BenchmarkBuildUserValue(b *testing.B) {
	for i := 0; i < b.N; i++ {
		_ = buildUserValue(i, "gopher")
	}
}

func BenchmarkBuildUserPointer(b *testing.B) {
	for i := 0; i < b.N; i++ {
		_ = buildUserPointer(i, "gopher")
	}
}
Run:
go test -bench=. -benchmem
The exact numbers depend on your Go version and machine, but the shape of the result is what matters. The pointer-returning version will usually show additional bytes per operation and more allocations per operation.
That is the full loop you want as an engineer:
- form a hypothesis,
- inspect compiler output,
- confirm with measurement,
- decide whether the result is important enough to justify code changes.
Practical Heuristics for Production Code
If you are reviewing performance-sensitive Go, a few heuristics are consistently useful:
- Suspicious interface-heavy boundaries deserve a quick allocation check.
- Closures are elegant, but captured state has a cost model.
- Returning large structs by value is not automatically wrong, but it is worth measuring.
- A single allocation in a cold path is usually irrelevant.
- A single allocation in a microservice hot loop can become real money.
The mature approach is not to fight the compiler. It is to understand the proof the compiler is making, and then optimize only when the numbers justify it.
Illustration Brief for the Design Pass
These diagrams should not be decorative. They should explain the internal model faster than paragraphs can.
1. The Lifetime Decision Diagram
Show a left-to-right pipeline:
Go source -> SSA form -> Escape analysis -> Stack or Heap decision -> Generated assembly
At the center, use a decision diamond with this question:
Can the compiler prove the value dies with the current frame?
The “yes” branch leads to stack-resident data. The “no” branch leads to heap allocation and GC visibility.
2. Stack Frame vs Heap Object
Draw one goroutine stack with three visible frames. Highlight the active frame. Inside it, place local variables and temporaries. Then draw a pointer escaping from that frame to a heap object outside the stack. Label the heap object as having a longer lifetime than the current frame.
3. Return by Value vs Return by Pointer
Use a two-column comparison. On the left, show a value copied back to the caller. On the right, show a local whose address is returned and therefore promoted to a heap object. Add a small assembly annotation under each column. The right side should call out runtime.newobject.
4. Common Escape Triggers Map
Create a radial map with five nodes: returned pointers, closures, interface boxing, goroutine handoff, and unknown callee behavior. Each node should have a one-line explanation and a small icon representing the reason the lifetime exceeds the frame.
Closing Thought
Escape analysis is not a bag of tricks for squeezing every value onto the stack. It is a way of thinking like the compiler.
Once you understand how Go proves lifetimes, you stop memorizing folklore and start making precise performance decisions backed by evidence.
In the next article, we move from memory placement to execution itself: how Go schedules goroutines across operating system threads, why the GMP model exists, and where work stealing, syscalls, and preemption fit into the runtime story.
Conversación